 Contributed by Joe Agin, Project Scientist, PPM Consultants
Introduction
Petroleum assessment and remediation projects presents consultants with a common and often challenging task: how to make real-time field decisions under regulatory programs that rely on laboratory confirmation. During underground storage tank (UST) closures, site assessments, or remedial excavations, field personnel must determine whether to continue excavation, whether soils require segregation, and where confirmation samples should be collected. These decisions must be made immediately, often under constrained schedules and cost limitations.
 As do most state regulatory programs, the Florida Department of Environmental Protection (FDEP) Petroleum Restoration Program establishes laboratory analysis as the definitive measure of compliance. However, certified laboratory results require significant turnaround times, commonly several days to weeks, which limits their value during live field operations. To bridge this gap, consultants rely on rapid field screening methods, with Organic Vapor Analyzers (OVAs) and Photoionization Detectors (PIDs) serving as the industry’s primary tools for volatile organic compound (VOC) detection.
The ability of PIDs and OVAs to provide qualitative information is well established. They identify relative areas of elevated petroleum impact and guide efficient sample collection. Yet the question remains whether these instruments can move beyond screening into the realm of prediction. Specifically, can OVA or PID readings be quantitatively correlated to laboratory-confirmed concentrations of gasoline range organics, diesel range organics, total recoverable petroleum hydrocarbons (TRPH), and aromatic constituents such as benzene, toluene, ethylbenzene, and xylenes (BTEX)?
This work addresses that question through two complementary analyses. First, a statewide statistical modeling effort was performed using an Artificial Intelligence (AI) model in RStudio, which applies machine learning algorithms to identify patterns and relationships within large environmental datasets, using historical paired OVA and laboratory datasets collected from multiple petroleum sites in the Florida Panhandle. Second, the same methodology was applied to one site, where paired OVA and laboratory data were collected during one phase of work. The statewide analysis revealed that universal predictive models are unreliable due to variability across Florida’s diverse geology and contaminant conditions. By contrast, the site-specific evaluation demonstrated that meaningful predictive relationships could emerge when analysis is constrained to a single facility or site.
The purpose of this blog article is twofold: (1) to document the methodology in sufficient detail that other practitioners could replicate the analysis, and (2) to clarify under what circumstances OVA/PID data can serve as reliable predictors of laboratory results in Florida petroleum remediation.
Background: Principles of PID Operation and Limitations
 A Photoionization Detector (PID) is an electronic sensor that detects volatile and semi-volatile organic vapors by exposing them to high-energy ultraviolet (UV) light. The operating principle is straightforward yet powerful. A UV lamp emits photons, typically with an ionization potential of 10.6 electron volts (eV). Compounds whose ionization energies are lower than the photon energy are ionized, producing cations and free electrons. An applied electric field collects these ions, generating a current proportional to the concentration of ionizable vapors. The instrument amplifies the current and reports concentrations, typically in parts per million by volume (ppm).
Many petroleum hydrocarbons, including BTEX compounds, fall below the 10.6 eV ionization threshold, making them detectable. Methane and other permanent gases, with ionization potentials exceeding 13 eV, do not interfere. As a result, PIDs are highly effective at detecting petroleum-related VOCs while ignoring the background atmospheric gases that dominate soil headspace samples.
Despite these advantages, PIDs suffer from well-documented sources of error.
Humidity interference is a primary concern in Florida. Water molecules absorb UV photons, reducing ionization efficiency and suppressing the measured signal. Relative humidity levels exceeding 80 percent can cause pronounced underestimation of VOCs.
Lamp degradation is another limitation. Over time, UV lamps lose intensity, and deposits on the quartz window attenuate photon flux. Unless lamps are cleaned and replaced on a strict schedule, response factors will drift.
Compound-specific response factors present another source of variability. PIDs are commonly calibrated against isobutylene. However, each hydrocarbon responds differently, and correction factors must be applied to convert readings into benzene-equivalents or xylene-equivalents. Without this adjustment, readings are strictly quantitative.
Cross-sensitivity complicates interpretation as well. A PID cannot distinguish between compounds with similar ionization potentials. Thus, any mixture of VOCs will produce an aggregated signal, which may or may not reflect petroleum hydrocarbons specifically.
Soil matrix effects also play a critical role. In headspace analysis, a soil aliquot is placed in a sealed container and equilibrated before the vapor phase is screened with a PID. Volatilization efficiency is influenced by soil texture, moisture, and temperature. Clay soils with high water content suppress VOC partitioning, while dry sandy soils allow rapid volatilization. Two soils with identical hydrocarbon concentrations can therefore yield very different headspace PID values.
Operational factors such as equilibration time, sample temperature, and ambient barometric pressure further influence reproducibility. Minor inconsistencies in sample handling often produce disproportionate variability.
Together, these limitations explain why PIDs and OVAs are trusted as qualitative tools but are rarely regarded as quantitative predictors. The purpose of the analyses described in this paper was to test that assumption directly, using statistical modeling applied to paired field and laboratory datasets.
Methodology
Data Compilation
Two datasets were compiled for analysis.
- Statewide Dataset: Historical data from multiple Florida petroleum remediation sites were assembled. This dataset consisted of paired OVA headspace readings (in ppm) and certified laboratory soil results for BTEX, MTBE, TRPH, and PAHs constituents. Data spanned different soil types, groundwater conditions, and stages of petroleum weathering.
- Site-Specific Dataset: A second dataset was collected at a single facility during one assessment phase. At this site, OVA headspace readings were obtained directly from soil borings, and corresponding samples were submitted to a certified laboratory for analysis of BTEX, MTBE, TRPH, and PAHs. This dataset offered the advantage of internal consistency, with all samples collected under the same conditions.
Analytical Approach in RStudio
The RStudio analysis was performed using R version 4.1 or greater. Datasets were imported into RStudio from Excel, cleaned for missing values, and adjusted where necessary. Non-detect laboratory results were set to half the method detection limit to allow regression analysis, and outliers were reviewed for accuracy. Both the OVA reading and laboratory concentration distributions were normalized before conducting a linear regression analysis.
Excel-Based Analysis
For the site-specific dataset, a parallel analysis was performed in Microsoft Excel. OVA readings were plotted against laboratory-confirmed concentrations, and regression lines with coefficients of determination (R²) were calculated directly. Scatter plots were inspected visually for linearity and outliers. Excel was used intentionally to demonstrate that meaningful relationships could be extracted using tools readily available to field practitioners without specialized statistical software.
Results
Statewide RStudio Modeling
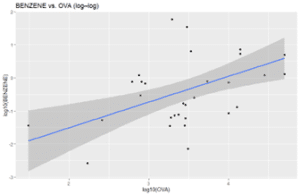 The statewide dataset revealed weak and inconsistent correlations between OVA readings and laboratory-confirmed concentrations. While higher OVA readings often corresponded to higher laboratory values, the scatter of data points was substantial, and the predictive equations were not reliable. Cross-validation demonstrated that models derived from one subset of sites performed poorly when tested against another, indicating that predictive power was not transferable. Even when advanced non-linear models were applied, predictive error remained high.
The reasons were clear. Soil heterogeneity across Florida introduced variability in headspace behavior. Moisture content varied dramatically between sites, suppressing or enhancing volatilization. Groundwater proximity, product weathering, and procedural inconsistencies compounded the problem. As a result, statewide regression models were unable to capture a universal relationship.
Site-Specific Analysis
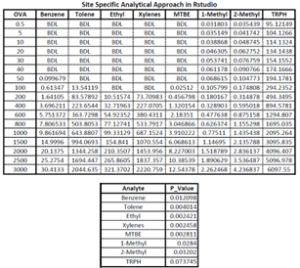
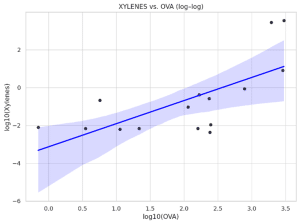 By contrast, the site-specific dataset revealed a clear and defensible relationship between OVA readings and laboratory-confirmed concentrations. In particular, total xylenes exhibited a strong linear correlation. As OVA readings increased, xylene concentrations rose proportionally, producing regression relationships with high coefficients of determination.
 The improvement was attributable to the homogeneity of conditions. All samples were collected under the same geologic and climatic environment, with consistent procedures. Soil type and moisture were relatively uniform across borings, and contaminant weathering was consistent. Under these circumstances, the noise that plagued the statewide analysis was minimized, allowing the OVA signal to track laboratory concentrations with practical reliability.
Discussion
The contrast between the statewide and site-specific results shows a convincing trend in the use of OVAs and PIDs in petroleum remediation. Based on this evaluation, these instruments appear highly sensitive and responsive, but their quantitative reliability is highly site-specific. Attempts to force a universal model across Florida fail because of the state’s geological and contaminant heterogeneity. Sandy soils in coastal Panhandle sites behave differently from clayey soils in the peninsula. Weathered diesel produces different headspace signatures than fresh gasoline. Groundwater conditions, sample handling, and even ambient weather contribute additional layers of variability.
However, when analysis is constrained to a single facility under consistent conditions, these confounding variables are controlled, either intentionally or by default. The result is a dataset in which the OVA response can be correlated more accurately to laboratory results. The strong correlation observed between OVA readings and total xylenes in the site-specific dataset demonstrates that predictive models can, in fact, be reliable at the local scale.
For practitioners, this finding has practical implications. First, it affirms that OVAs and PIDs should not be used to predict concentrations across sites, as any universal regression is indefensible. Second, it demonstrates that site-specific correlation is possible and valuable. Consultants who collect paired OVA and laboratory data during initial phases of work can, with relatively simple regression analysis, create predictive relationships that enhance efficiency in subsequent field events. This approach allows practitioners to anticipate exceedances, optimize sample collection, and guide excavation decisions in real time.
It must be emphasized that laboratory confirmation remains essential. Field screening cannot replace laboratory data for regulatory decision-making. However, site-specific predictive models enable consultants to use OVAs more intelligently, integrating them not just as qualitative screeners but as semi-quantitative tools calibrated to local conditions.
If you wish to discuss the results of this evaluation in more detail, feel free to reach out to me at joe.agin@ppmco.com.
Conclusion
Photoionization detectors and organic vapor analyzers remain indispensable tools in petroleum remediation practice. Their sensitivity, speed, and portability make them unmatched for field screening. Yet their limitations – humidity interference, compound-specific response factors, soil matrix effects, and operational variability – prevent them from serving as universal predictors of laboratory results.
The statewide RStudio modeling effort demonstrated that predictive models fail when applied across Florida’s diverse range of sites. However, when the same analysis was applied at the site-specific scale, strong correlations emerged, particularly for total xylenes. This demonstrates that predictive modeling of OVA data is feasible, but only when applied within the narrow context of a single facility under consistent conditions.
For Florida consultants and regulators, the lesson is clear. OVA and PID data should be treated as site-calibrated tools, not as universal predictors. When applied thoughtfully, site-specific calibration improves the efficiency and defensibility of field decision-making. It provides practitioners with a quantitative framework for interpreting screening data while respecting the necessity of laboratory confirmation.
This dual perspective – acknowledging the limitations of broad predictive models while embracing the potential of site-specific calibration – supports a more nuanced and scientifically defensible use of OVAs and PIDs in petroleum remediation.